
.png")
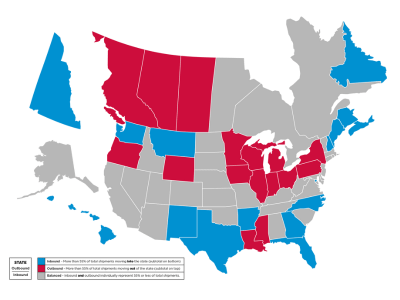
The 2018 Atlas® Van Lines Migration Patterns study found that 23 states registered as balanced—meaning that moves in and out of the states were roughly equal—14 as outbound, and 13 as inbound, in addition to Washington, D.C. Furthermore, the data showed a decrease in moves in 2018. The company has conducted the study since 1993 to track the nation’s interstate (between states) and cross-border (U.S. to Canada) moving patterns annually as reflected in moves handled by Atlas.
The 10 U.S. states with the highest percentage of inbound moves and outbound moves are included in order below, with Nevada ranking as the study’s inbound leader for the first time ever. While West Virginia has classified as outbound since 2014, the state had the highest percentage of outbound moves in 2018. This is also the first time West Virginia has registered as the study’s outbound leader.
In 2018, the total number of interstate and cross-border moves in North America reached 71,092, down slightly from 72,986 in 2017. Former inbound states Alaska and Rhode Island became balanced in 2018, ending Alaska’s former three-year streak of classifying as inbound. After spending 2017 as balanced states, New Hampshire, New Mexico and Virginia became inbound. Iowa and Oklahoma also changed from outbound to balanced in 2018.
International Top 10: Destinations & Origins
Atlas® World Group International conducted 6,394 international household goods moves in 2018, down slightly from 7,748 in 2017.
Looking for more domestic and international moving trends?
See the complete 2018 Migration Patterns Study at:
atlasvanlines.com/migration-patterns
.png?lang=en-US&ext=.png)
.png?lang=en-US&ext=.png)